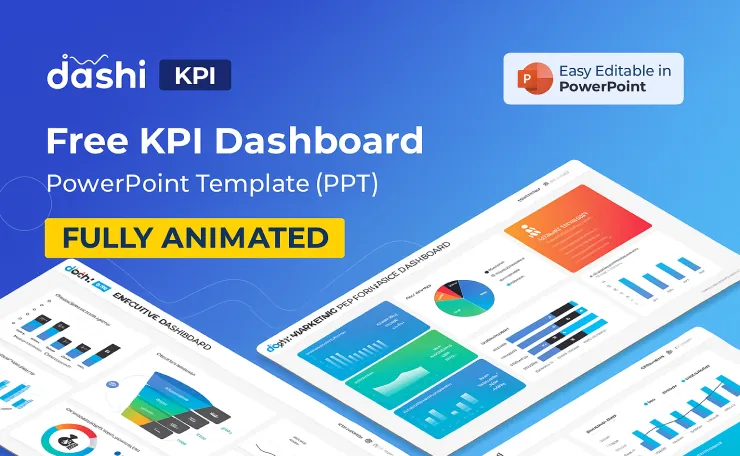
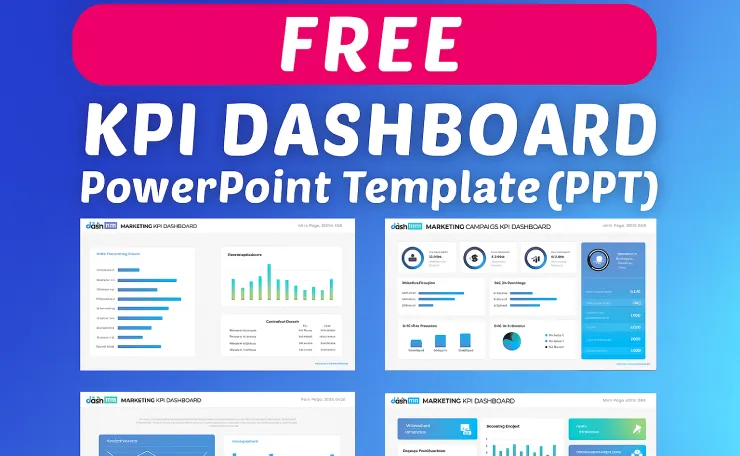
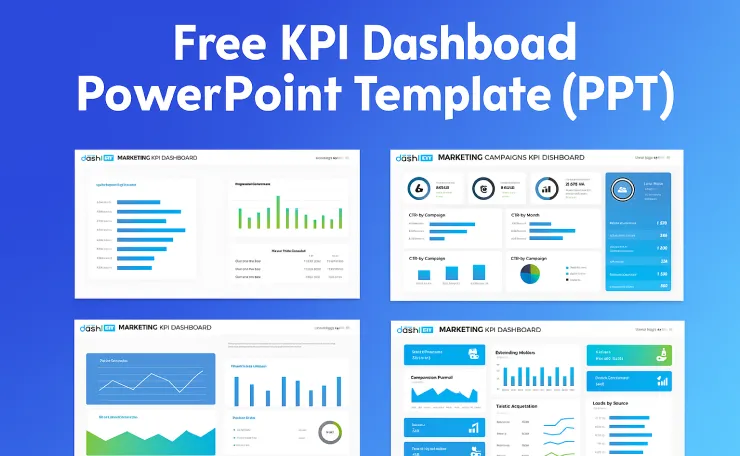
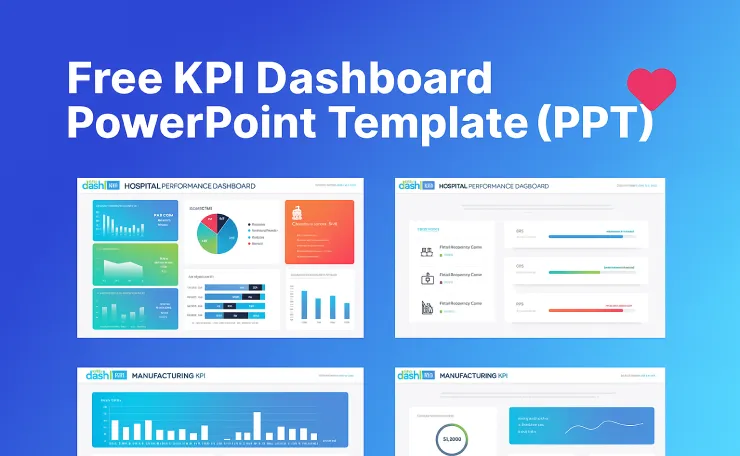
If you share performance updates with clients or leadership, you know how hard it is to turn raw numbers into a clear story. This free KPI Dashboard PowerPoint template (PPT) gives you ready-made, editable slides to showcase sales, finance, marketing, operations, and customer KPIs—without building visuals from scratch. Import your data, tweak the colors, and present a professional KPI dashboard presentation in minutes.
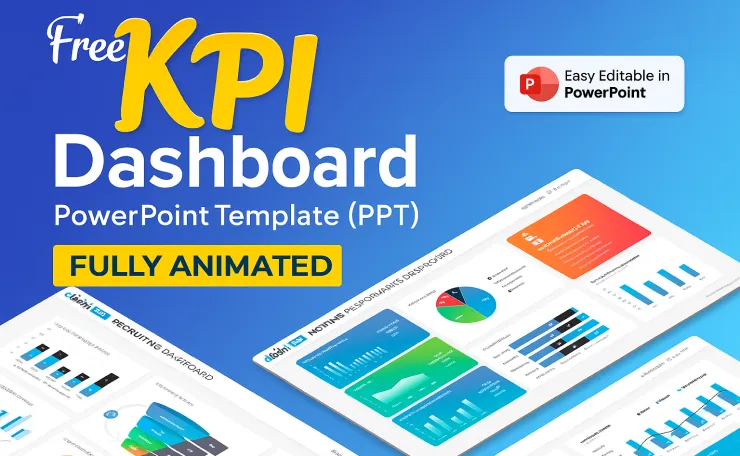
Free Download

- [Presentation Clicker & Laser Pointer]This is a presentation remote with a very bright red laser pointer. You can change…
- [Amazing Ergonomically] PPT remote control has a amazing ergonomic design makes you soft touch and comfortable to grip.T…
- [Plug and Play] No software or drives to install. Simply plug in the USB receiver and turn on the presenter clicker wire…
$21.99
What’s Inside the Template
This dashboard PowerPoint template is designed for real-world reporting and fast stakeholder reviews:
- Fully editable slides (charts, text, icons, shapes)
- Business KPI presentation slides for revenue, pipeline, CAC/LTV, margin, churn/retention, NPS/CSAT, website traffic, conversions, and more
- Data visualization PowerPoint components: line/area/bar charts, scorecards, comparison tables, funnel, and cohort visuals
- Master slide layout for consistent typography and spacing
- 16:9 HD format for boardroom screens and online meetings
- Light & dark color themes so your deck is brand-ready
- Optional animated KPI slides (subtle transitions) to highlight key deltas
Who This Template Is For
- Marketing teams: traffic, CTR, CPA, ROAS, MQL→SQL conversion
- Sales leaders: bookings, pipeline health, win rate, average deal value, sales cycle
- Finance and ops: revenue, gross margin, burn, unit economics, inventory turns, on-time delivery
- Customer success: churn, expansion MRR, retention cohorts, NPS/CSAT
- Founders/consultants: quick professional KPI report templates for clients and investors
Why Use a KPI Dashboard Presentation vs. Raw Spreadsheets
- Clarity: executives want trends and insights, not cell references.
- Speed: reuse slide layouts monthly/quarterly—just refresh numbers.
- Consistency: one PowerPoint data dashboard template keeps visuals aligned.
- Storytelling: annotate insights, add comparisons, and show “what changed” since the last period.
Free Download

- [Plug and Play] No drivers required. Just plug into the USB dongle,then start seamless switching. Wireless control Dista…
- [Compact Rechargeable Presentation Clicker] PowerPoint clicker can easily charge from your computer through Type/USB C p…
- [Amazing Ergonomic] Clicker for powerpoint presentations has a smooth but grippy texture to it, so you don’t have to wor…
$24.99
How to Customize (5-Minute Setup)
- Pick a theme: light or dark, then update the color palette to match your brand.
- Paste data: replace sample numbers in charts (right-click → Edit Data).
- Select slides: keep only the KPIs you actually track (less is more).
- Add commentary: one insight per slide—what happened, why, and what’s next.
- Export & share: present live, export to PDF, or share a link via Teams/Zoom..
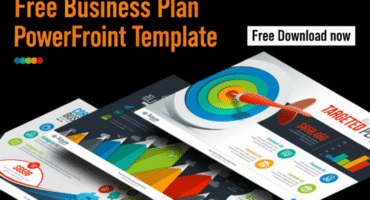
Free Business Plan PowerPoint Template Download: Win Your Next Pitch
Best-Practice KPI Structure (Steal This Flow)
- Executive Summary: 3–5 topline metrics, traffic-light status (on/off track)
- Growth: new vs. returning, acquisition by channel, CAC/LTV trend
- Revenue & Sales: pipeline build, forecast accuracy, win rate, ASP
- Profitability & Ops: COGS, gross margin, OPEX ratio, inventory/lead times
- Customer Health: churn, net revenue retention, NPS, ticket backlog/SLAs
- Web & Product: sessions, conversion rate, activation, feature adoption
- Risks & Actions: key blockers, experiments, next-step owners
Tips to Make Your KPI Slides Stand Out
- One slide = one message. Put the main takeaway in the title (e.g., “Q3 NRR up to 118%, driven by Expansion in Enterprise”).
- Use comparison elements: MoM/YoY, plan vs. actual, and benchmarks.
- Label peaks/dips: call out campaigns, seasonality, outages, or pricing changes.
- Color with intent: green for good, red for risks. Keep it consistent.
- Limit decimals: round smartly for readability.
- Add a “Data Notes” footer: sources, refresh date, and any caveats.
Included Slide Types (Mix & Match)
- KPI Scorecards: revenue, MRR, margin, churn, CAC, LTV, NPS
- Trend Lines: growth over time, rolling averages
- Funnels: acquisition, sales stages, onboarding
- Cohorts/Retention: percentages by start month/segment
- Attribution & Channels: ROAS, CPA, assisted conversions
- Benchmarks: industry vs. your current metrics
- Roadmap & Actions: experiments, owners, deadlines
Free Download

- [Presentation Clicker with Red Laser Pointer] PowerPoint clicker controls range:98FT/30M, laser pointer range: 328FT/100…
- [Wonderful Ergonomically] Wireless presentation clicker for PowerPoint presentations has a amazing ergonomic design that…
- [USB A & USB C 2 in 1 Receiver, Plug and Play] No installation needed, no assembly or hard instructions to follow. Just …
$15.99
- Monthly business reviews (MBR) and Quarterly business reviews (QBR)
- Board updates with concise KPI dashboard PPT slides
- Client reporting for agencies and consultants
- Team stand-ups to align goals and priorities
Download & License
This article offers a free KPI dashboard PowerPoint template for personal and commercial presentation use. You can modify and reuse the slides in client and company decks. Redistribution or resale of the raw template file is not permitted—please link back to this page instead.
Download: [Insert your download button/link here]
Optional: gate with email capture for lead generation.
Free Download
- [Presentation Clicker with Laser Pointer] PowerPoint clicker controls range:98FT/30M, laser pointer range: 328FT/100M. C…
- [Wonderful Ergonomically] Wireless presentation clicker for PowerPoint presentations has a amazing ergonomic design that…
- [Plug and Play] No installation needed, no assembly or hard instructions to follow. Just plug and play. You simply plug …
$14.99
FAQ
Q1. What is a KPI dashboard presentation?
A KPI dashboard presentation is a set of slides that visualizes business metrics—like revenue, churn, or ROAS—so stakeholders can understand performance at a glance and make decisions faster.
Q2. Can I edit the charts and colors?
Yes. This editable KPI PowerPoint uses standard PPT charts and a master slide layout. Update data and switch colors to match your brand.
Q3. Does it work in Google Slides or Keynote?
Yes—most users can import PPT files into Google Slides or Keynote. Minor adjustments to fonts or spacing may be needed.
Q4. Is the template really free?
Yes, the download is free for presentation use. You may not resell or upload the raw template to other marketplaces.
Q5. What KPIs should I include?
Start with 3–5 that reflect your goals (e.g., MRR growth, NRR, CAC payback). Add more only if they inform decisions.


2 Comments